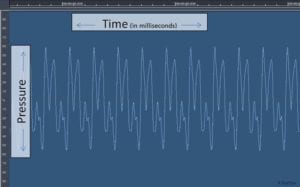
The waveform is the shape of a wave. Below is a graph on paper of a waveform representing the sound waves created by blowing through a clarinet. Where the air pressure is higher, the line on the graph is higher. Where the air pressure is lower, the line on the graph is lower. Also, the higher the air pressure, the higher the clarinet’s pitch.
Sound waves created by a clarinet. [Image source: Rburtonresearch – Own work, CC BY-SA 4.0, https://commons.wikimedia.org/w/index.php?curid=45035734]The horizontal axis of the graph shows the passage of time in tiny fractions of a second. The vertical axis shows air pressure, and, thus, pitch. Atmospheric air pressure which would prevail if there were no sound at all is indicated by 0, in the middle of the vertical axis. The graph has been generated electronically. The air pressure created by blowing through the clarinet has been translated by a microphone into an electrical impulse and hooked up to a graphing device, perhaps a computer.
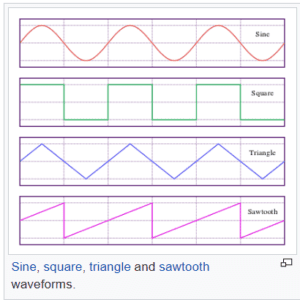
[Image source: By Omegatron – Own work, https://commons.wikimedia.org/w/index.php?curid=343520. Retrieved from https://en.wikipedia.org/wiki/Wave Retrieved Sept. 21, 2017]Some waveforms flow smoothly and others, when graphed, take more angular or jagged forms, as in the diagram to the right. Again, time runs across the horizontal axis and the measurement of some phenomenon, let’s say the intensity of a light, runs vertically. Consider the square waveform, the green line, for example. It shows that the light intensity remains at a high level for a bit of time, virtually instantaneously drops to a low level for the same amount of time, virtually instantaneously returns to its high level for the same amount of time, drops…etc.
These, of course, are idealized graphs of waveforms that might be created by calculations. They are not the imprint on paper reflecting actual waves as in the prior image of the clarinet notes.
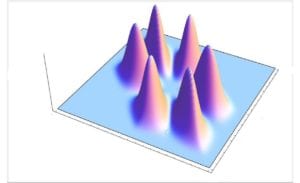
A 3-dimensional wave with 6 peaks. [Image source: By Omegatron – Own work, https://commons.wikimedia.org/w/index.php?curid=343520. Retrieved Sept. 21, 2017]Waves can be shown three-dimensionally as well. The accompanying diagram shows a three-dimensional presentation of a wave. In this still image, we see the wave cresting in six peaks. Were this diagram animated, we would see the peaks dissolve and, in their stead, troughs would form. In our three-dimensional world, all waveforms are really three-dimensional. But, sometimes, it’s desirable to abstract a single dimension like air pressure or light intensity and graph this single dimension against time.